I’m an incorrigible data packrat, so when we got the Tourtoise and Hare, I got to work seeing what I could gather. Here’s a little sample…
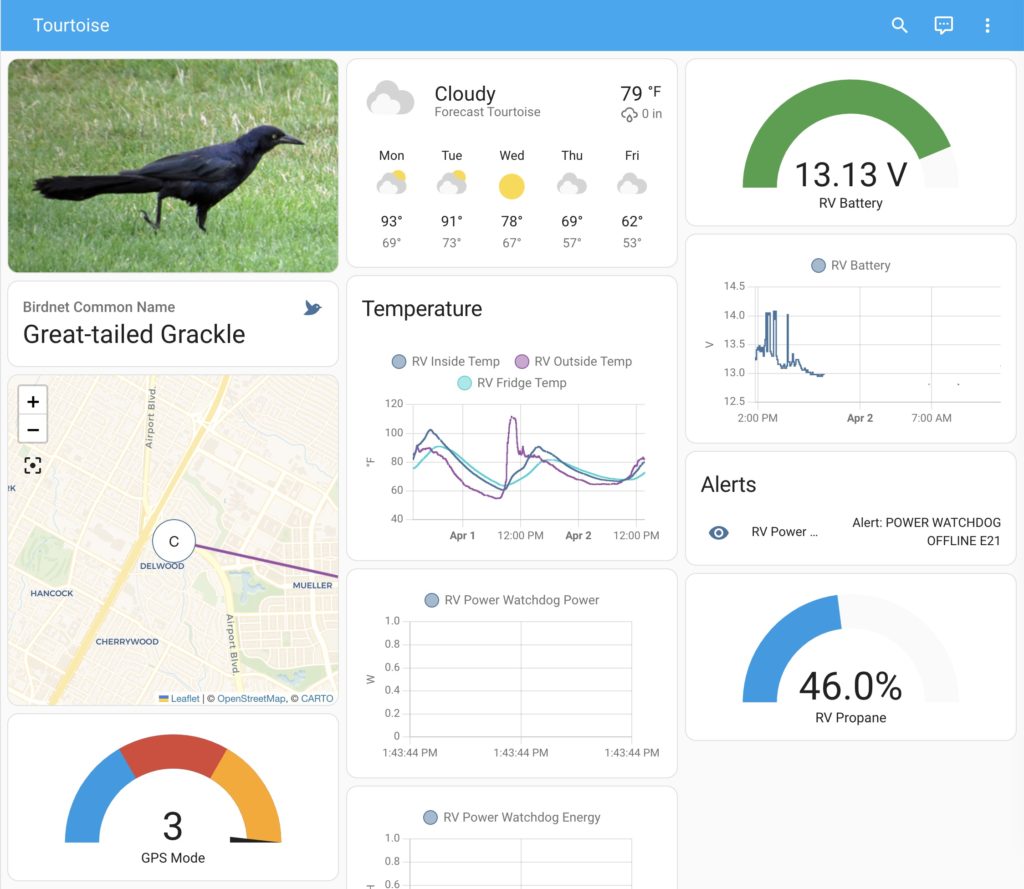
I’m using Home Assistant to integrate everything into nice dashboards and send out alerts. It has a lot of built-in plugins, but several of these took some customization.
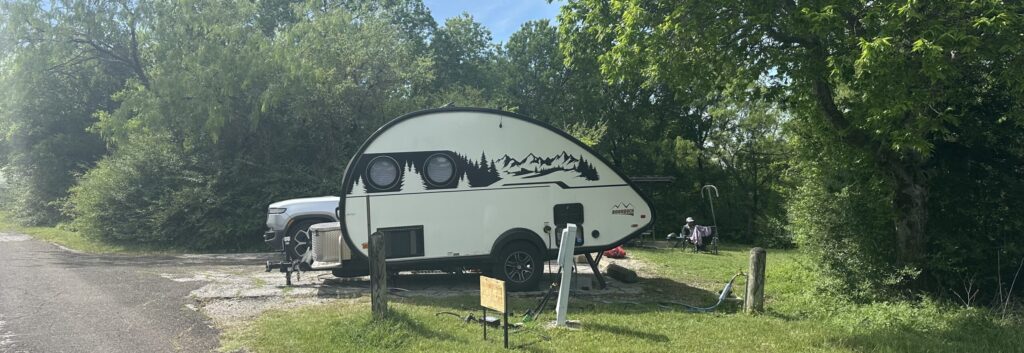
Tourtoise has a Raspberry Pi that lives in it and runs off of the 12V power. I originally set it up to run BirdNET-Pi to listen for birds while we’re camping. This powers the bird photo and name widgets. The trailer is parked at home in Austin right now, so, of course, the latest bird update is our municipal mascot.
The GPS data is from an Adafruit GPS Hat with an external antenna, so it mostly doesn’t claim that the trailer is in the middle of Africa. Mostly.
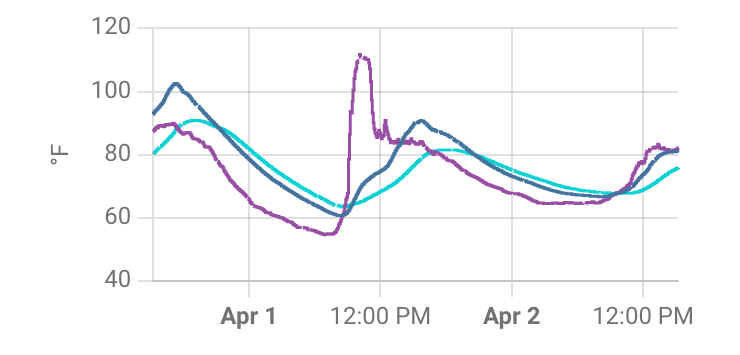
For the temperature, propane, and power data, we have an RV Whisper and various sensors. Because the RV Whisper is also a Raspberry Pi under the hood, I was able to set up a REST API and use that to get the data into Home Assistant.
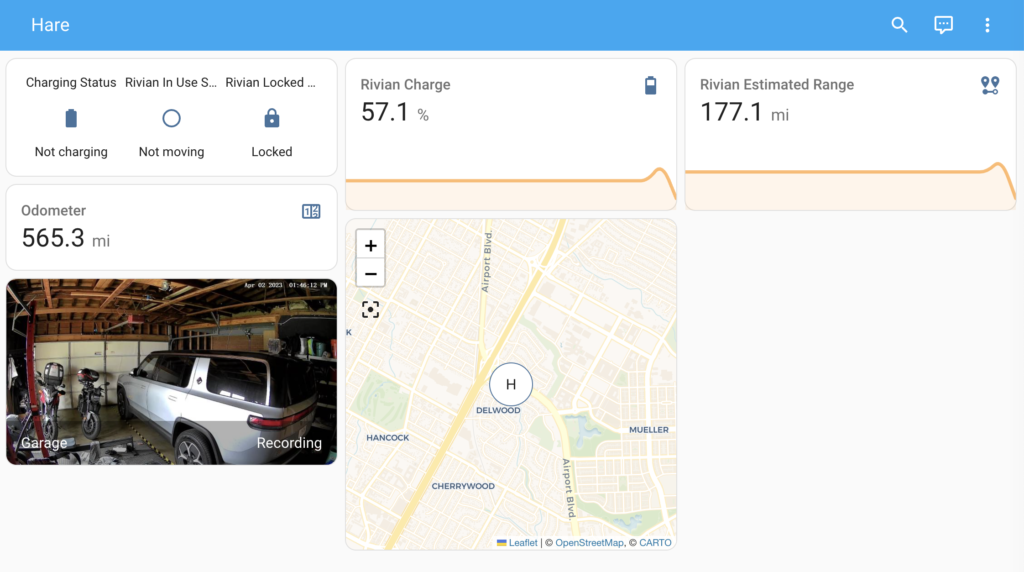
On the Hare side, I’ve set up an unofficial Home Assistant plugin so we can see basic data from the SUV. There’s a lot of other data in there, but it didn’t seem very useful to have my wiper fluid status on my home dashboard.
I’m hoping to get the data about the Hare loaded into A Better Route Planner so that we get better estimates. I’ve had to estimate the power consumption while towing to get reasonable routes, but it should get better when fed with the actual data. I’m waiting on an ABRP Telemetry API key to do that.